

Peptide purity is normally reported as HPLC area percent: of all material the detector registered, that percentage was the target peptide. It says nothing about water, salts or counter-ions, which are invisible to it. Net peptide content is the separate figure, reported here as a measured mass against label strength, and across the 42 lots carrying it the median is 107.9%.
- Peptide purity on a listing is an HPLC area percentage: of all the material the detector registered, that share was the target peptide.
- The figure is relative to what was detected, so water, inorganic salts and the trifluoroacetate counter-ion stay outside it while still being real mass in the vial.
- Peptide purity grades are specification bands, not quality scores: >75% is specified for antibody work, >85% for enzyme assays, >95% for quantitative analysis, and the grade is chosen against the measurement, not against a marketing ladder.
- Peptide purity says how much of one component is present; only mass spectrometry says whether that component is the molecule named, which is why a peptide certificate of analysis reporting both is worth more than a higher percentage on its own.
- Above roughly 99% the question worth asking is who measured the lot in front of you: of the 51 certificates published against their lot numbers here, 49 report a measured HPLC figure between 99.247% and 99.984% and the other two report a pass at not less than 99%, and every one of them names the laboratory that produced it.
How peptide purity is calculated
A sample is dissolved and pushed through a reversed-phase high-performance liquid chromatography column, RP-HPLC, which separates its components by how strongly each one sticks to the column packing. A detector at the far end registers each component as it comes off, drawing a peak. The area under each peak is proportional to how much of that component passed the detector.
Peptide purity is then the area of the target peak divided by the total area of all peaks, expressed as a percentage. Ninety-nine per cent purity means the main peak accounted for 99% of everything the detector saw.
The detector is almost always a UV absorbance cell set at 214 nanometres, where the peptide bond itself absorbs; 220 nm is the other common setting. Both read the backbone rather than any one side chain, which is what makes them general enough to use across sequences without recalibrating for each. Every Freedom Diagnostics certificate in this library states RP-HPLC at 214 nm, and the second laboratory represented here, pH Solutions, runs its peptide purity assay at 274 nm. It is the same measurement made a different way, and the certificate says which.
Two consequences follow immediately. First, the figure is relative. It compares the target against the other things that were detected, not against the contents of the vial. Second, it depends on the method: the column, the gradient, the wavelength. A well-specified peptide certificate of analysis states those conditions, which is why a chromatogram is worth more than a number typed onto a page.
- 0 nm
- UV detection wavelength on the RP-HPLC peptide purity assay
- Stated method on the Freedom Diagnostics certificates archived here
- 0
- signed certificates published, one per released lot
- Certificate library, 11 compounds
- 0
- independent laboratories behind those certificates
- Freedom Diagnostics and pH Solutions
What a peptide purity percentage leaves out
Most peptide detection uses ultraviolet absorbance at around 214 nanometres, where the peptide bond absorbs. Anything that does not absorb there is not on the chart. Water is invisible. Inorganic salts are invisible. Residual solvent is largely invisible.
Counter-ions are the significant one. Peptides are usually purified by HPLC using trifluoroacetic acid, and they come off that process as a salt: the peptide paired with trifluoroacetate. That counter-ion can account for a meaningful share of the vial's mass, and it does not appear in an area-percent peptide purity figure at all.
How much it accounts for depends on the sequence. A peptide carrying several arginine or lysine residues has more positive charge to balance, so it binds more counter-ion, and the same chemistry makes the dry solid more hygroscopic, quicker to pull water out of the air once the vial is open. Two sequences purified on the same day to the same area percent can therefore differ by several per cent in how much of the powder is actually peptide. Counter-ion can be exchanged for acetate or hydrochloride by a further ion-exchange step, but the exchange is sequence-dependent, is never quite complete, and leaves residual trifluoroacetate that has to be quantified separately if the number is going to mean anything.
So a vial labelled 10mg at 99% peptide purity does not contain 9.9mg of peptide. It contains a fill of lyophilized powder that is 99% pure by chromatography, part of whose mass is water and counter-ion rather than peptide. That is why the certificates here report content as a measured mass against the label strength rather than as a share of the dry solid: across the 42 lots carrying that figure it runs from 93.6% to 131.6% of label, because the fill is set above target so that the labelled mass survives the water and the counter-ion. Nothing dishonest is happening; the two numbers simply answer different questions. The same split between a ratio and a mass is set out from first principles in what is a peptide.
| Figure | Question it answers | Method | Typical value | What it cannot tell you |
|---|---|---|---|---|
| HPLC purity | Of everything detected, how much was the target? | RP-HPLC with UV detection at 214 nm | 95 to 99.9% area percent | Nothing about mass, and nothing about identity |
| Identity | Is the main peak the molecule named? | LC-MS, observed against theoretical mass | Confirmed, or not | Nothing about how much is present |
| Net peptide content | Of the dry mass, how much is peptide? | Amino acid analysis or nitrogen determination | 93.6% to 131.6% of label on the 42 lots reporting it | Which peptide it is, or how clean |
| Fill mass | How much solid is in the vial? | Gravimetric fill, ideally verified vial by vial | 10mg, 50mg, 1000mg | Nothing analytical at all: it is a target unless conformance is reported |
HPLC area percent
Of what the detector saw, how much was the target. The peptide purity number quoted on almost every listing in this category.
Net peptide content
Of the dry mass, how much is peptide. Measured separately by amino acid analysis or nitrogen determination, both of which fall under peptide purity testing. The certificates here state it as milligrams of peptide against the label strength: 93.6% to 131.6% of label across the 42 lots that carry the figure.
Identity
Whether the main peak is the right molecule at all. Answered by mass spectrometry, not by purity.
Fill mass
How much solid the vial holds. A gravimetric target rather than an analytical result, which is why a certificate that confirms fill conformance vial by vial is saying more than a label alone.
Peptide purity grades, and what each grade is specified for
Suppliers of synthesised peptides sell against specification bands rather than a single standard, and the bands are older than the research-chemical market. They come from the custom-synthesis trade, where the buyer states the measurement they intend to make and the vendor quotes the cheapest grade that will support it. Crude material is the floor: cleaved from the resin, desalted, not chromatographically purified, and sold as such.
The logic of the ladder is worth stating plainly, because it is the opposite of how a retail listing reads. A higher grade is not a better product in the abstract; it is a narrower impurity budget. Antibody production tolerates a wide one, because the target of that work is a sequence and a few per cent of truncated chains does not change which sequence it is. Quantitative work tolerates almost none, because every impurity is mass that was weighed and counted as target.
Two things follow. The first is that a grade describes analytical suitability and nothing else: it is a statement about what a measurement can survive, not a permission or a recommendation for any other use. The second is that once a supplier is quoting 99% and above, the grade has stopped discriminating: the whole catalogue sits in the same band, and the only thing that separates one vial from another is whether the peptide purity figure was measured on that lot and published with the document behind it.
| Minimum HPLC purity | Common designation | Specified for | What it will not support | Where this catalogue sits |
|---|---|---|---|---|
| Unpurified | Crude | Screening libraries, solubility trials, resin-cleavage checks: work where the sequence only has to be present | Any quantitative measurement; any work where a by-product could be read as the target | Not offered |
| >70 to 75% | Immuno grade | Polyclonal antibody production, ELISA coating, peptide arrays, epitope mapping | Quantitative analysis; structural work | Not offered |
| >85% | Biochemistry grade | Enzyme assays, in-vitro bioassays, phosphorylation studies, blocking peptides | NMR, crystallography, receptor-ligand quantitation | Not offered |
| >95% | High-purity grade | Quantitative analysis, NMR, receptor-ligand binding work, in-vitro bioassay where an impurity would confound the read | Atomic-resolution structure determination | Below the specification used here |
| >98% | Industrial or structural grade | Crystallography, structure-activity work, use as an in-house reference standard | Little in a research setting | Below the specification used here |
| ≥99% | Reference-standard grade | Work where the impurity budget is the limiting term in the measurement | Nothing analytical, at a cost premium that flattens above this point | Every lot published here: 49 measured at 99.247% to 99.984%, two reported as a pass at not less than 99% |
Where the impurities come from
Almost every peptide in this category is made by solid-phase peptide synthesis. A single amino acid is anchored to a resin bead, and the chain is built one residue at a time: deprotect the growing end, couple the next residue, wash, repeat. A fifteen-residue sequence is fourteen coupling cycles, each with its own deprotection and its own wash, and each one an opportunity for a fraction of the chains on the bead to fall out of step.
That is the mechanism behind the impurity profile. A coupling that goes to 99.5% completion leaves half a per cent of the chains one residue short, and because those chains stay on the resin they keep growing, producing a full-length molecule with one amino acid missing from the middle. That is a deletion sequence, and it is the hardest impurity to remove precisely because it is so nearly the target. Capping, which acetylates any chain that failed to couple so it cannot grow further, converts what would have been deletions into truncations: shorter, more polar, and far easier to separate.
The final cleavage step brings its own. Side chains are carried through synthesis under protecting groups, and stripping them all off cleanly at the end is a chemistry problem in its own right. A group that survives leaves a molecule heavier than the target and more hydrophobic, while an over-aggressive cleavage cocktail can modify residues it was meant to leave alone. None of this is unusual or a sign of a bad synthesis. It is why purification exists, and why the interesting question on a certificate is not how much impurity there is but which impurity it is.
| Impurity | Where it arises | Mass difference against the target | How it appears | Why it is hard or easy to remove |
|---|---|---|---|---|
| Deletion sequence | A coupling cycle that did not go to completion, leaving a fraction of chains one residue short | Lighter by one residue: 57 Da for glycine, up to 186 Da for tryptophan | A shoulder or a close-eluting peak beside the main one; a discrete mass gap on LC-MS | Hard. Chemically almost identical to the target, so it elutes almost at the same retention time |
| Truncated chain | Synthesis stopped early on part of the resin; capping prevents further growth | Much lighter, by the mass of every residue never added | A well-separated earlier peak, usually more polar | Easy. The difficulty is knowing it was there, not removing it |
| Incomplete deprotection | A side-chain protecting group survives the final cleavage | Heavier by the mass of the group retained | A later-eluting, more hydrophobic peak | Easy to separate, but the mass has to be read to identify what it is |
| Oxidation at Met or Trp | Air and light during work-up, drying or storage | +16 Da per oxygen added | An earlier, more polar peak; a +16 satellite on the mass spectrum | Removable, but it re-forms after purification as readily as before it |
| Deamidation at Asn or Gln | Hydrolysis of a side-chain amide, favoured by moisture and higher pH | +1 Da | Very close on HPLC; needs mass resolution to see at all | Hard to see, which is the real problem, because a low-resolution method will not resolve it |
| Aggregate or dimer | Chains associating, often through a cysteine forming a disulfide bridge | Roughly double the target mass, or 2 Da lighter for an intramolecular bridge | A broad or late peak; a doubled mass series | Method-dependent, because some aggregation reverses under the run conditions |
Degradation is a different class of impurity
Everything above happens during manufacture. A second family appears afterwards, and it is the one a peptide purity figure is least able to describe, because the figure was recorded before any of it had time to occur. A certificate is a measurement of a lot on a date, not a property the material carries permanently.
Water drives most of it. Hydrolysis cleaves the backbone, which is why material is lyophilised in the first place and why a dry cake is stable in a way a solution is not. Oxygen and light do the rest, adding sixteen daltons at a methionine or tryptophan. Deamidation at asparagine or glutamine shifts a mass by one dalton and is easy for a routine method to miss entirely. Aggregation is driven by concentration and by temperature cycling, which is the argument for not thawing and refreezing a vial repeatedly.
This is where purity and storage stop being separate subjects. A 99.9% figure on a lot that has since spent a fortnight at room temperature in a humid room is a historical document. The storage conditions for each state, set out in how to store peptides, are what hold material close to the figure on its certificate. Reconstitution is the moment the clock speeds up, which is why the choice of diluent, bacteriostatic water for peptides or plain sterile water, belongs in the same conversation as the peptide purity percentage.
| Route | What drives it | What it does to the material | What would document it |
|---|---|---|---|
| Hydrolysis | Water, as residual moisture in the cake or in the solution after reconstitution | Cleaves the backbone, producing shorter fragments that show as new peaks | Karl Fischer water content, plus a repeat HPLC run on a retained sample |
| Oxidation | Oxygen and light at Met, Trp and Cys | Adds +16 Da species that read as impurity on both HPLC and MS | LC-MS on the retained sample |
| Deamidation | Moisture and higher pH at Asn and Gln | A +1 Da species a low-resolution method will not separate | High-resolution mass spectrometry |
| Aggregation | Concentration, freeze-thaw cycling, temperature swings | Broad or late peaks and a loss of area under the main peak | Repeat HPLC injection, plus visual inspection of the cake |
| Moisture uptake | A hygroscopic solid drawing water from air once the vial is open | Nothing measurable immediately, but it starts hydrolysis | Weighed water content on the opened vial |
95, 98 and 99 per cent peptide purity: what actually changes
The difference between 95% and 99% is not four per cent of the material; it is a fivefold difference in impurity. A 95% preparation carries five parts impurity per hundred, a 99% preparation carries one. For work where an impurity can confound a measurement, that ratio is the meaningful comparison.
What those impurities are matters more than how many. A preparation at 98% whose two per cent is a well-separated truncation is a more predictable reagent than one at 99% whose one per cent is a deletion sequence sitting under the shoulder of the main peak, because the second one is both harder to see and closer in behaviour to the thing being measured. This is the argument for the chromatogram over the number: the number cannot distinguish those two cases and the trace does at a glance.
Above about 99% the returns flatten and the cost does not. Each additional decimal costs a further purification pass, a further loss of yield, and a further analytical run to demonstrate it. The practical question stops being how high the number is and becomes whether it was measured, by whom, and on this lot, which is where vetting a research peptide supplier begins.
Why two laboratories report different peptide purity for the same lot
Peptide purity as area percent is not an absolute property of a sample. It is the output of a method, and changing the method changes the number without anything changing in the vial. The same lot can read 98.4% on one system and 99.3% on another, and both results can be correct.
The two laboratories whose certificates are archived here make the point without needing a hypothetical. Freedom Diagnostics reports RP-HPLC at 214 nm and states the result to three decimal places. pH Solutions runs its purity assay at 274 nm and reports it as a pass against a specification of not less than 99%, alongside fill-weight conformance counted vial by vial, 337 of 337 on one lot and 94 of 94 on another. One document gives a measurement, the other gives a conformance statement. Neither is the weaker document; they answer different questions, and reading them as though they were the same scale is the mistake.
The variable that moves a peptide purity number most is the one least often printed. An impurity with no strong chromophore at the chosen wavelength contributes almost no area, so it is not so much under-counted as absent. Integration is the second: where the analyst drew the baseline and the peak boundaries moves a result by tenths of a per cent on the same raw data. This is why 'NLT 99%' and '99.786%' are not comparable statements. The first is a specification the lot had to meet; the second is what was found.
| Method variable | Typical setting | Effect on the reported percentage | What to check on the certificate |
|---|---|---|---|
| Detection wavelength | 214 nm or 220 nm; 274 nm on one of the two laboratories represented here | An impurity that absorbs weakly at that wavelength contributes little area and is effectively not counted | The wavelength is printed, not implied |
| Column chemistry | C18, with particle size, pore size and dimensions stated | Decides whether a close-eluting deletion sequence resolves or hides under the main peak | Column type and dimensions named |
| Gradient and run time | A shallow gradient over a longer run separates more | A steep, short gradient compresses peaks together and tends to read higher | The gradient programme, or at minimum the run time |
| Injection load | Micrograms on column | An overloaded column broadens the main peak and buries small impurities beneath it | Injection volume and sample concentration |
| Integration and baseline | Analyst-set peak start, peak end and baseline | Moves the result by tenths of a per cent with no change to the sample | That a chromatogram is attached and the integration is visible on it |
| Reporting convention | Three decimal places, or a pass against a written specification | 99% as a pass and 99.786% as a result are different kinds of statement | Whether the figure is a measurement or a specification |
What each analytical method can and cannot bound
No single instrument answers the whole question, and a certificate that runs to one page is usually a certificate that ran one assay. Knowing what each method is blind to is most of what it takes to read one critically.
One thing is true of all 51 lots published here: an RP-HPLC purity result. Identity is confirmed by LC-MS on 48 of the 51, and on the other three by retention-time match against a certified reference standard. Everything else is true of some lots and not others. A measured content figure appears on 42 of the 51, bacterial endotoxin on 17 of the 51, and residual solvents and elemental impurities only on the two pH Solutions certificates. That is why those results sit on the lot record rather than in a catalogue-wide claim. A site that prints an assay panel as universal, when the document linked from the same page runs half of it, has published something a reader can falsify in about ten seconds.
The methods below are the ones worth asking about. Several will not appear on a research-peptide certificate at any supplier, which is a fact about the market rather than a criticism of one seller. It does mean, though, that a supplier claiming them should be able to show the page of the report where they were run.
| Method | What it measures | What it does not measure | In this library |
|---|---|---|---|
| RP-HPLC with UV detection | Relative amount of each UV-absorbing component | Anything transparent at the detection wavelength; identity | All 51 lots |
| LC-MS (electrospray) | Molecular mass of the components against the theoretical mass for the sequence | How much is present by mass | 48 of the 51 lots; the other three confirm identity by retention-time match against a certified reference standard |
| Net peptide content | Peptide mass as a share of dry mass | Which impurities are present | A measured figure on 42 of the 51 lots |
| Karl Fischer water content | Water content of the dry solid | Everything except water | Not reported |
| Headspace GC | Residual solvents left after lyophilisation | Non-volatile impurities | The two pH Solutions lots |
| Ion chromatography | Counter-ion content, trifluoroacetate or acetate | The peptide itself | Not reported |
| Capillary electrophoresis | Separation by charge, as an orthogonal check on HPLC | Mass, and therefore identity | Not reported |
| Bacterial endotoxin (LAL, USP <85>) | Endotoxin burden of the material | Chemical purity or identity | 17 of the 51 lots |
| Elemental impurities (ICP) | Metal content | Organic impurities | The two pH Solutions lots |
Purity without identity proves nothing
A high peptide purity figure says a sample was clean. It does not say what it was clean of. Both questions have to be answered, and they are answered by different instruments.
Mass spectrometry supplies the second. It measures the molecular mass of the main component and compares it against the theoretical mass calculated from the sequence. Agreement within a small tolerance demonstrates that the substance present is the substance named.
The tolerance matters as much as the match, and it is the part a certificate usually leaves unstated. A modern LC-MS instrument measures mass to within a few parts per million. A report that claims agreement only to within a tenth of a per cent is describing the instrument rather than the sample: for BPC-157, whose molecular weight is 1419.53 daltons, 0.1% is 1.4 daltons either way, a window wide enough to swallow a deamidation, which moves the mass by one. Where a tolerance is quoted in daltons rather than per cent, two daltons is the figure commonly used for a routine confirmation.
A certificate showing a 99% HPLC figure and no mass spectrum has told you half the story, and it is the less important half. Every lot in this catalogue is assayed for both by an independent laboratory, and the report is published against the lot number printed on the vial.
Reading the chromatogram itself
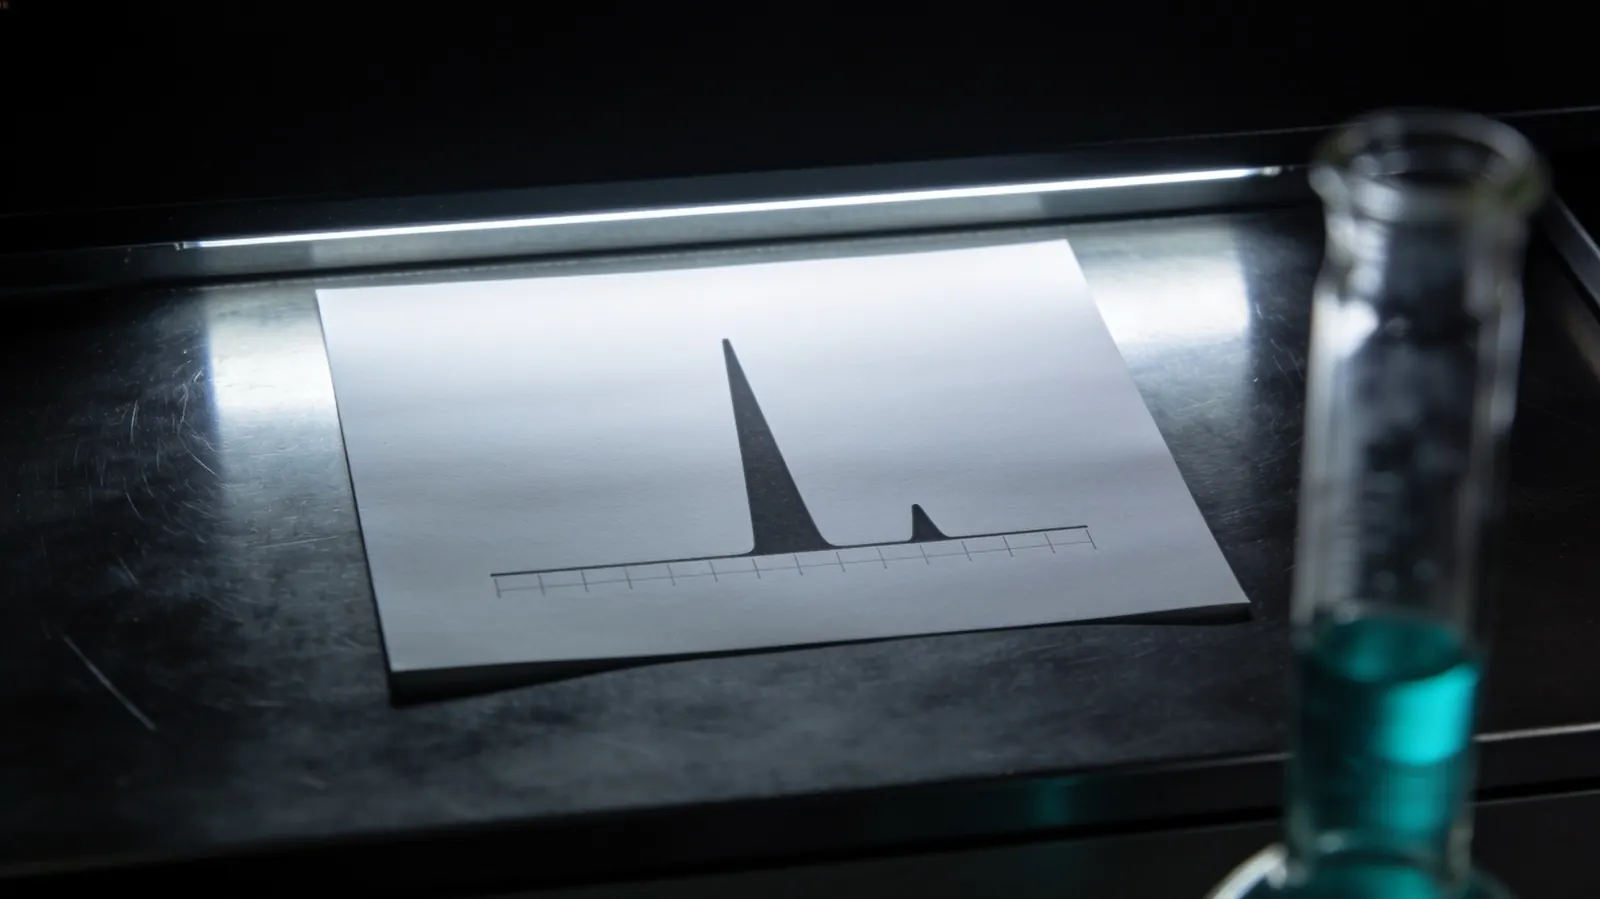
A certificate that attaches its chromatogram is offering the evidence rather than the summary, and the trace can be read without any training in chromatography. Four things are worth looking at, and all four are visible in a few seconds.
What a chromatogram cannot show is a component that never absorbed. Counter-ion, water and inorganic salt leave no mark on a UV trace at 214 nm, so a flat, clean baseline is not by itself evidence that the vial contains nothing but peptide. It is evidence that nothing else absorbing at that wavelength came off the column during the run, which is a narrower and more useful claim.
Axis labels and a scale
Time on the horizontal axis, detector response on the vertical, both labelled and both with numbers. A trace printed without a scale is a picture of a chromatogram rather than a chromatogram.
Retention time
The time at which the main peak comes off. It should match the retention time quoted in the method and, where the laboratory runs one, the retention time of a certified reference standard, which is how the pH Solutions certificates in this library state identity.
Peak symmetry and shoulders
A clean main peak is close to symmetrical. A bulge on one side is a component eluting almost with the target, and in a synthesised peptide that is usually a deletion sequence. It is the single most informative feature on the page.
The baseline and the integration marks
Small peaks are only counted if the analyst's integration included them. Where the software has drawn its baseline and its peak boundaries is printed on the trace, and it is what turns a picture into a number.
One lot's peptide purity is not the next lot's
Every peptide purity figure describes one batch. Synthesis is a chemical process with normal variation in it, so the same sequence made twice by the same manufacturer on the same route will not give the same number, and the certificate for a lot bought in March says nothing binding about a lot shipped in September. This is the reason a lot number exists at all.
The spread across the 49 lots here that were reported to three decimal places runs from 99.247% to 99.984%, with a median of 99.786%. Every one of those figures was produced by an outside laboratory on the specific batch, and every certificate is published against its lot number whether or not that batch is still in stock, including the older and lower results, because a library that quietly drops its weakest documents is not a library.
What that makes possible is the only check worth doing. Read the lot number off the vial, find that lot in the library, and confirm that the document names the same compound, the same strength and a date that precedes the release. A supplier that publishes one certificate as a specimen and prints a different lot number on the vials has published a sample, not a record. Looking a lot number up directly takes about as long as reading this paragraph.
- 0%
- lowest HPLC peptide purity result in the published library
- BPC-157 lot BPC11182025-J, Freedom Diagnostics
- 0%
- highest HPLC result in the published library
- Ipamorelin lot 500001, Freedom Diagnostics
- 0%
- median across the 49 lots reported to three decimals
- Calculated across the archived certificates
Measured peptide purity across this catalogue
Almost everything written about this subject, including most of this article, discusses peptide purity in the abstract. The figures below are not abstract: each one is the HPLC result on a named lot, produced by an outside laboratory, with the signed report published at the lot number.
Alongside purity, these certificates report a measured content figure against the label strength, and it is worth explaining, because it does not read the way people expect. Across the 42 single-compound lots that carry one, measured content runs from 93.6% to 131.6% of the label strength, with a median of 107.9%. Vials are filled above target so that the labelled mass is present after the dry solid's water and counter-ion are accounted for; the certificate is what turns that from an assumption into a number. Nine of the 42 read below the label figure, and those certificates are published too.
The repair panel, the growth panel and the metabolic reference set carry no certificate of their own. They are dispatched as their component vials, each with the certificate for its own lot, which is the only arrangement that keeps a lot number meaningful. Bacteriostatic water is the one line in the catalogue with no peptide purity figure at all: there is no analyte to assay, so the water is specified as USP sterile rather than reported as a percentage.
- 0%
- median measured content as a share of label strength
- Across the 42 single-compound lots carrying a content figure
- 0
- lots whose certificate states a measured content figure
- Of 51 published certificates
- 0
- compounds with at least one published certificate
- Certificate library
| Compound | Lot | Vial size on that certificate | HPLC purity | Identity |
|---|---|---|---|---|
| GLP-3 RT | PSNN1N | 10mg | 99.90% | Confirmed by LC-MS |
| GLP-1 | GS20-032026-1 | 20mg | 99.689% | Conforms, reference match |
| Tesamorelin | TESM-052026-4 | 10mg | 99.87% | Confirmed by LC-MS |
| Ipamorelin | VNA7TB | 10mg | 99.90% | Confirmed by LC-MS |
| BPC-157 | 2FRBRG | 10mg | 99.51% | Confirmed by LC-MS |
| TB-500 | PQ7MWD | 10mg | 99.58% | Confirmed by LC-MS |
| GHK-Cu | GHK100-052026-4 | 100mg | 99.86% | Confirmed by LC-MS |
| MOTS-c | MOT10-052026-4 | 10mg | 99.76% | Confirmed by LC-MS |
| NAD+ | NAD1000-052026-1 | 1000mg | 99.94% | Confirmed by LC-MS |
| GLOW | GLOW-062026-4 | 70mg | 99.68% | Confirmed by LC-MS, per component |
| KLOW | XX1EZC | 80mg | 99.76% | Confirmed by LC-MS, per component |
| Bacteriostatic water | None assigned | 3ml and 10ml | No assay: USP sterile water, not a peptide | Not applicable |
Every lot, with the document behind it
The 51 certificates behind the figures in this table are published in full, including the lots that are no longer in stock and the ones that read lowest.
Open the certificate libraryWho measured it, and what accreditation adds
A peptide purity figure has an author. In-house quality control run by the manufacturer is a real measurement and is not worthless, but it is a party reporting on its own work, and there is no external step between the result and the number on the listing. Independent testing puts a laboratory with no commercial interest in the outcome between the two.
ISO/IEC 17025 is the standard that describes what a testing laboratory has to demonstrate: competence for the specific methods it is accredited for, traceable calibration, documented procedures, and participation in proficiency testing against other laboratories. It is narrower than it sounds. Accreditation is granted for a defined scope, so a laboratory can be accredited and still run an unaccredited method, which is why the scope matters more than the logo. Of the two laboratories behind the certificates here, pH Solutions reports under ISO/IEC 17025 accreditation.
Buyers can commission their own testing, and some do. The costs commonly quoted by contract analytical laboratories put a single RP-HPLC purity run in the region of $50 to $150 a sample, with a comprehensive panel covering identity by LC-MS, amino acid analysis, water and counter-ion content running from several hundred dollars upward; peptide purity testing and what each method costs are set out separately. Independent re-testing of a vial you already hold is the strongest form of verification there is, and it is also the reason a supplier should be comfortable telling you which laboratory produced its own figures and on which lot.
Peptide purity, read properly, is three numbers rather than one: the HPLC area percentage, the net peptide content that puts it in context, and the mass-spectrometry result that confirms the molecule is what it claims to be. A listing that quotes only the first is not lying, but it is answering the easiest question, and a grade band on its own answers an easier one still. Ask for the chromatogram, the lot number and the laboratory's name, and the figure starts to mean something.
Common questions
What does 99% peptide purity mean?
That in an HPLC run, 99% of the total detected peak area was the target peptide. It is a measure of what the detector saw, not of the vial's whole contents: water, salts and counter-ions are not included.
What is purity in peptides?
Peptide purity is the proportion of the detected material that was the intended sequence, measured by reversed-phase HPLC and reported as an area percentage. It is a relative figure: the target peak against every peak the detector registered. It is not a measure of how much peptide the vial holds by mass, and it is not a statement of identity.
What percent purity is good for peptides?
It depends on the measurement. Antibody work and ELISA coating are commonly specified at above 70 to 75%, enzyme assays and in-vitro bioassays at above 85%, and quantitative analysis, NMR and receptor-ligand work at above 95%. Research-grade material is usually sold at 98% or higher, and this catalogue runs 99% or above on every published lot, with 49 of the 51 measured at 99.247% or higher.
Is 95% purity good for peptides?
For most biochemical assay work, yes. 95% is the band specified for quantitative analysis and receptor-ligand studies. It carries five parts impurity per hundred against one part at 99%, so where an impurity could be counted as target it is worth the step up. What matters alongside the number is which impurity makes up the five per cent, and that is a question only the chromatogram answers.
Why is net peptide content lower than HPLC purity?
Because they measure different things. HPLC peptide purity compares the target against other detected components; net peptide content compares peptide mass against the dry mass of the solid, which also contains water and counter-ions such as trifluoroacetate.
What are the impurities in a peptide preparation?
Most commonly deletion sequences missing a single residue, truncated chains, side-chain protecting groups that survived cleavage, and oxidation products at methionine or tryptophan. Deletion sequences are the hardest to remove because they are chemically so similar to the target. Separately from synthesis, degradation produces its own: hydrolysis fragments, deamidation products and aggregates.
What is a crude peptide?
Material cleaved from the synthesis resin and desalted, but never chromatographically purified. It is a legitimate grade with a legitimate use: screening libraries and solubility trials, where the sequence only has to be present. It is quoted as crude rather than given a percentage, and it will not support any measurement in which a by-product could be mistaken for the target.
Does 10mg at 99% purity mean 9.9mg of peptide?
No. The 99% is an HPLC area percentage describing the material the detector registered, while the 10mg is the label strength, and the dry solid in the vial also contains water and counter-ion. Net peptide content is the figure that turns vial mass into peptide mass, and the certificates here report it as a measured mass against the label: 93.6% to 131.6% of label across the 42 lots that carry it, with a median of 107.9%.
Is peptide purity the same as potency?
No. Peptide purity is a chromatographic ratio, the target peak against every peak the detector saw, and it says nothing about how much peptide the vial holds by mass. That is net peptide content, measured separately. It also says nothing about whether the material is the intended molecule, which is settled by mass spectrometry, one of the assays covered under peptide purity testing.
What is TFA in peptides, and can it be removed?
Trifluoroacetic acid is the ion-pairing agent used in reversed-phase purification, so most peptides are isolated as a trifluoroacetate salt. That counter-ion is part of the vial's mass and is invisible to a UV purity trace, which is one reason net peptide content sits below HPLC purity. It can be exchanged for acetate or hydrochloride by a further ion-exchange step, but the exchange is sequence-dependent and rarely complete, so residual trifluoroacetate should be quantified directly by peptide purity testing rather than assumed away.
How can I check a peptide purity claim myself?
Read the lot number off the vial and find that same lot on the seller's site. Every lot here has its report published, and a lot number can be looked up directly. Then check that the certificate names an independent laboratory, a method and a date, and that the chromatogram carries axis labels, a scale and retention times. A percentage with no lot number, no laboratory and no chromatogram attaches to nothing.
Why do two labs give different purity results for the same peptide?
Because area percent depends on the method. The column, the gradient, the injection load, the integration and above all the detection wavelength decide which impurities are resolved and how strongly each absorbs, so the same sample can read 98.4% on one method and 99.3% on another. The two laboratories behind the certificates here run 214 nm and 274 nm respectively, and one reports to three decimals while the other reports a pass against a specification.
Can a peptide be 99% pure and still be the wrong peptide?
Yes. Purity describes how much of the detected material sat under one peak; it does not identify that peak. Identity comes from mass spectrometry, which compares observed molecular mass against the theoretical mass for the stated sequence. A peptide certificate of analysis with no identity result has answered the easier half of the question.
Do I need to see the chromatogram, or is the purity percentage enough?
The chromatogram is the evidence; the percentage is a summary of it. A trace with labelled axes, a scale and retention times shows where the impurities sit and how cleanly they were separated, none of which a typed number can show. A shoulder on the main peak, in particular, is invisible in a percentage and obvious on a trace. Where only a number is offered, treat it as a claim rather than a measurement.
What does NLT 99% mean on a peptide label?
NLT stands for 'not less than', so it is the specification the lot had to meet rather than the result that was actually recorded. A complete certificate carries both: the specification and the measured figure for that specific lot. A document quoting only the specification has told you what was aimed at, not what was found.
What does ISO 17025 mean on a peptide certificate of analysis?
ISO/IEC 17025 is the international standard for the competence of testing laboratories. An accredited laboratory has demonstrated method competence, traceable calibration and documented procedures, and takes part in proficiency testing against its peers. Accreditation is granted for a defined scope, so the useful question is whether the specific method on your certificate falls inside it. Of the two laboratories behind the certificates published here, pH Solutions reports under ISO/IEC 17025 accreditation.
How much does independent peptide purity testing cost?
Contract analytical laboratories commonly quote around $50 to $150 for a single RP-HPLC purity run, and from several hundred dollars upward for a panel adding LC-MS identity, amino acid analysis and water or counter-ion content. Peptide purity testing, what each method reports and what it costs, is covered separately. Sending a vial you already hold to an outside laboratory is the strongest verification available to a buyer.
Which laboratories test research peptides?
Several independent laboratories serve this market and researchers often name Janoshik, which publishes reports directly to the customer. The certificates published here were produced by Freedom Diagnostics and by pH Solutions, which reports under ISO/IEC 17025 accreditation. What matters is less the name than whether the laboratory is independent of the seller and whether the report names your lot.
Does peptide purity change while the vial is in storage?
A peptide purity figure describes the lot at the moment it was tested, not permanently. Lyophilised peptide is stable because the water that drives hydrolysis has been removed, which is why material ships as a dry cake of lyophilized powder, but heat, moisture and repeated freeze-thaw degrade it over time. The conditions set out in how to store peptides are what hold the material close to the figure on its certificate.
Does the water used to reconstitute a peptide affect its purity?
Reconstitution does not alter the HPLC peptide purity measured on the dry powder, but it decides what else ends up in the solution. Bacteriostatic water for peptides is sterile water with 0.9% benzyl alcohol as a preservative, sterile water contains nothing at all, and a poor-quality diluent introduces contaminants no certificate for the peptide ever covered. Vials of bacteriostatic water are supplied for laboratory reconstitution alongside the compounds.
What shouldn't you mix with peptides?
As a handling question: anything whose composition is not documented. A diluent with no certificate, a buffer of unknown pH, or a second compound combined in one vial all put material into the solution that the peptide's own certificate never covered, and nothing downstream can separate the effects afterwards. Sterile water vs bacteriostatic water is a difference of exactly one component, and which of the two is appropriate is a documentation question before it is anything else.
What are the top three peptides?
That question is usually answered by search volume rather than evidence. Judged by depth of published preclinical literature, the three most studied compounds in this catalogue are BPC-157, TB-500 and GHK-Cu, each with decades of model-system work behind it. All material here is supplied for in-vitro laboratory research only.
What is the most trustworthy peptide company?
Trust is not a property a seller can assert about itself, so the question is better asked as a checklist. Does a certificate exist for the lot number printed on the vial, not for a specimen lot? Was it produced by a laboratory independent of the seller, and is that laboratory named? Does it report identity as well as purity? Are the older and weaker certificates still published? The full set of checks worth running on a research peptide supplier takes about ten minutes.
- ICH Q6A, Specifications: Test Procedures and Acceptance Criteria: the framework in which a purity result is read against an acceptance criterion, and why impurity limits are set per specification rather than as a single standard
- ICH Q2(R2), Validation of Analytical Procedures: that specificity, accuracy and precision are attributes of the analytical procedure, which is why a peptide purity figure travels with its method
- FDA, Lyophilization of Parenterals, Inspection Technical Guide: residual moisture and cake attributes in a lyophilised solid, the mass that an area-percent figure does not see
- PubChem CID 9941957, BPC-157: the BPC-157 molecular weight used in the worked example of a mass-tolerance window
Read more
- How to read a peptide certificate of analysisA peptide certificate of analysis is the only document that connects the vial in your hand to a measurement. Most buyers glance at one number on it and miss the three that matter.
- Peptide purity testing: the methods, the laboratories and what they costPeptide purity testing is not one test. It is a short panel of quite different measurements run on different instruments, and knowing which is which tells you how much a certificate is worth.
- Bacteriostatic water storage and shelf lifeBacteriostatic water storage is simpler than most people expect, and the 28-day figure everyone quotes is measuring something quite specific.
- Sterile water vs bacteriostatic waterSterile water vs bacteriostatic water is a question about one ingredient and one consequence: whether the vial can be opened more than once. The labels answer it in figures.
- What is bacteriostatic water?What is bacteriostatic water, exactly? It is one ingredient away from ordinary sterile water, and that one ingredient is the entire reason it exists.
- What is a peptide?What is a peptide, in the vocabulary that every specification sheet, sequence line and certificate in this library already assumes. This is the page to read first.
For laboratory research use only. All compounds listed on this site are sold strictly as reference materials for in-vitro laboratory research conducted by qualified professionals. They are not drugs, foods, cosmetics, or medical devices. They are not intended for human or veterinary consumption, therapeutic use, diagnostic application, or any in-vivo use whatsoever. These statements have not been evaluated by the Food and Drug Administration. By purchasing, you affirm that you are a qualified researcher and that you will comply with all applicable institutional, local, state and federal regulations governing the handling of research chemicals. Published by SERVIAM BIO LABS.